Human heart failure
In this notebook, we show how to infer cell-level spatial transcriptome and how to perform analyses on the tissue samples from human heart failure patients with myocardial infarction.
Thor inference
Pathway enrichment analysis
Transcription factor analyses
Semi-supervised annotation of fibrotic cells (link to external video tutorials to Mjolnir platform, which is to be launched)
The input data and Thor processed data can be downloaded from our google drive or from the original Nature paper. Aliases (in parentesis) are used in our manuscript of the sample names appeared in the original paper: RZ_GT_P2(RZ1), RZ_P11(RZ2), GT_IZ_P9(IZ1), IZ_P10(IZ2), FZ_GT_P19(FZ1), FZ_P18(FZ2).
For installation of Thor, please refer to this installation guide.
Import the packages
[1]:
import os
import logging
import datetime
import numpy as np

logger = logging.getLogger()
logger.setLevel(logging.INFO)
logging.basicConfig(format='%(name)s - %(levelname)s - %(message)s')

now = datetime.datetime.now()
logger.info(f"Current Time: {now}")
root - INFO - Current Time: 2023-12-13 00:13:40.927335
[2]:
%config InlineBackend.figure_format = 'retina'

import matplotlib.pyplot as plt
from matplotlib.colors import LinearSegmentedColormap
import scanpy as sc
import decoupler as dc
import warnings

warnings.filterwarnings("ignore")
sc.set_figure_params(scanpy=True, dpi=150, dpi_save=300)
sc.settings.verbosity = 'error'

from thor.analy import get_pathway_score, get_tf_activity
from thor.finest import fineST
from thor.pl import colors
Predicting cell-level gene expression using Markov graph diffusion
There are in total of six samples. We use sample “RZ_GT_P2” as an exmaple. All the process and parameters were kept the same.
We also skip the preprocessing of the images and the spatial transcriptome data in this tutorial. Please refer to the other two tutorials for preprocessing. The preprocessed data can be downloaded from the same google drive link.
[3]:
samples = ['RZ_GT_P2', 'RZ_P11', 'GT_IZ_P9', 'IZ_P10', 'FZ_GT_P19', 'FZ_P18']

library_names = {
    'FZ_P20': 'Visium_16_CK294',
    'FZ_GT_P19': 'Visium_14_CK292',
    'GT_IZ_P9': 'Visium_9_CK287',
    'IZ_P10': 'Visium_7_CK285',
    'RZ_P11': 'Visium_8_CK286',
    'RZ_GT_P2': 'Visium_5_CK283'
    }
[4]:
sn = samples[0]
# Below are the files you needed to run Thor
image_path = os.path.join("HE_image", sn, f"{library_names[sn]}.tif")
cell_features_csv_path = os.path.join("WSI_HF", sn, f"features_{sn}.csv")
cell_mask_path = os.path.join("WSI_HF", sn, f"nucleis_{sn}_mask.npz")
spot_adata_path = os.path.join("Spatial_HF", sn, f"{sn}_adata_spots_thor_processed.h5ad")
rz = fineST(
image_path,
sn,
spot_adata_path=spot_adata_path,
cell_features_csv_path=cell_features_csv_path,
recipe='gene'
)
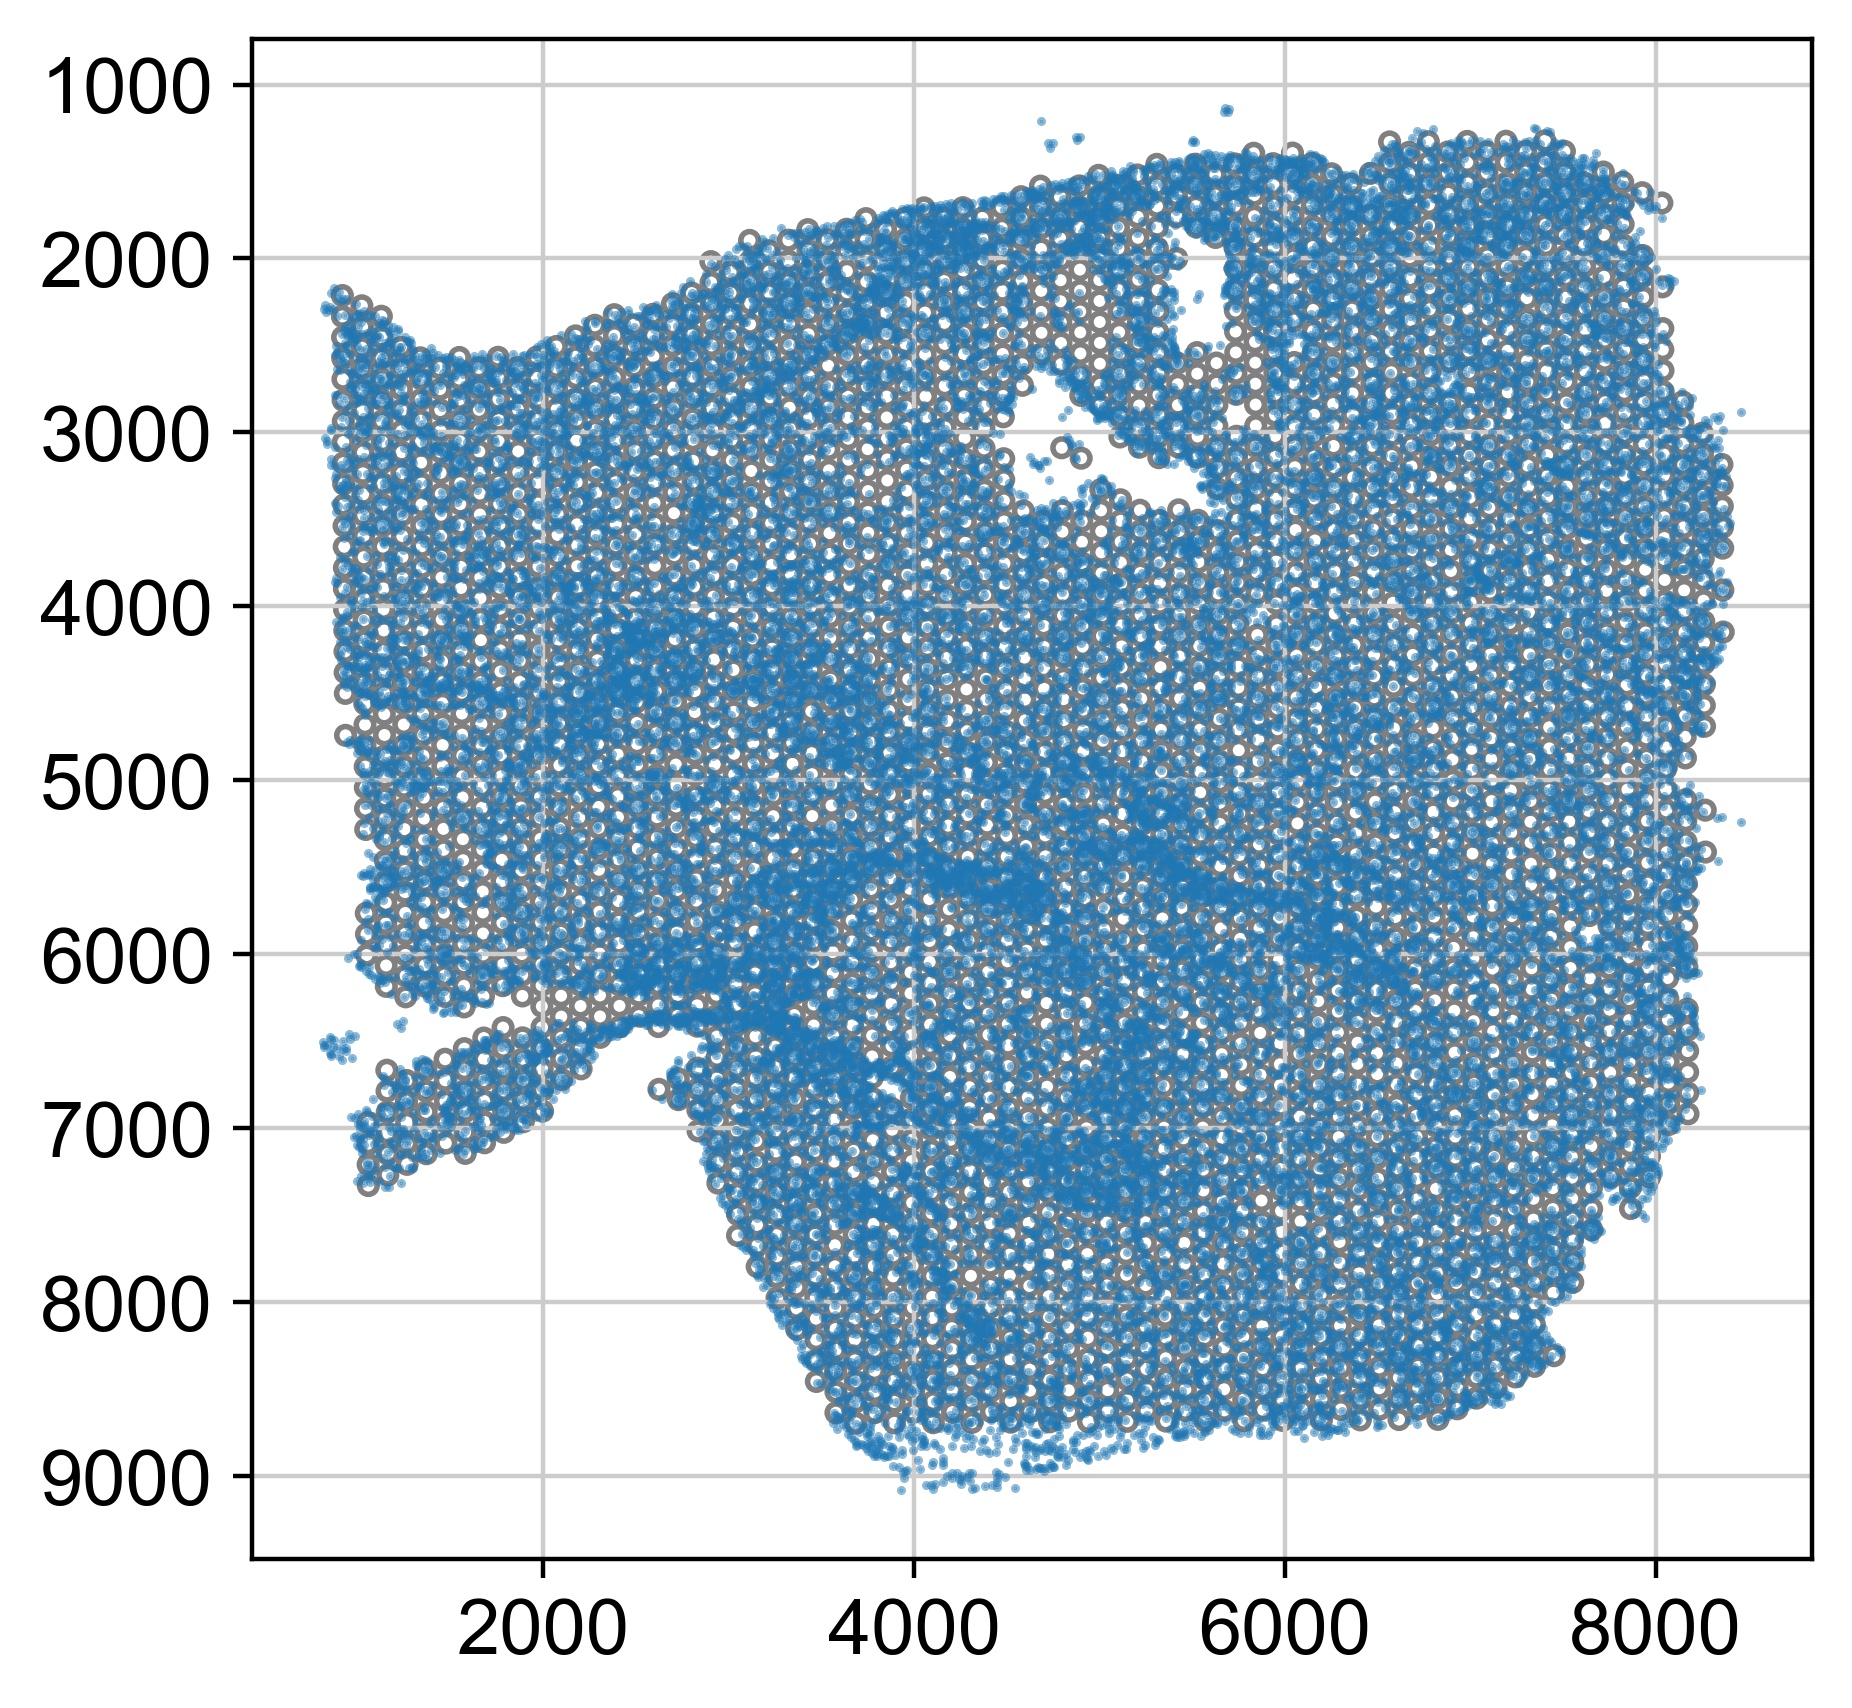
rz.prepare_input(mapping_margin=10)
[12/13/23 00:13:46] INFO     Thor: Please check alignment of cells and spots
                    INFO     Thor: The first two columns in the node_feat DataFrame need to match the spatial coordinates from obsm['spatial'].
                    INFO     Thor: Mapping cells to the closest spots within 10 x the spot radius
[5]:
rz.adata
[5]:
AnnData object with n_obs × n_vars = 32994 × 14467
    obs: 'n_counts', 'n_genes', 'percent.mt', 'Adipocyte', 'Cardiomyocyte', 'Endothelial', 'Fibroblast', 'Lymphoid', 'Mast', 'Myeloid', 'Neuronal', 'Pericyte', 'Cycling.cells', 'vSMCs', 'cell_type_original', 'assay_ontology_term_id', 'cell_type_ontology_term_id', 'development_stage_ontology_term_id', 'disease_ontology_term_id', 'ethnicity_ontology_term_id', 'is_primary_data', 'organism_ontology_term_id', 'sex_ontology_term_id', 'tissue_ontology_term_id', 'spot_barcodes', 'x', 'y', 'mean_gray', 'std_gray', 'entropy_img', 'mean_r', 'mean_g', 'mean_b', 'std_r', 'std_g', 'std_b', 'spot_heterogeneity'
    var: 'features'
    uns: 'X_approximate_distribution', 'X_normalization', 'default_embedding', 'schema_version', 'spatial', 'title', 'cell_image_props'
    obsm: 'X_pca', 'X_spatial', 'X_umap', 'spatial'
Run time ~ 10 mins for 32994 cells and 14467 genes on a MacbookPro M2 laptop.
[6]:
rz.set_genes_for_prediction(genes_selection_key='all')

rz.set_params(
    out_prefix="fineST",
    is_rawCounts=False,
    layer=None,
    is_rawCount=True,
    write_freq=20,
    n_iter=20,
    smoothing_scale=0.8,
    node_features_obs_list=['spot_heterogeneity'],
    n_neighbors=5,
    geom_morph_ratio=1,
    inflation_percentage=None,
    regulate_expression_mean=False,
    stochastic_expression_neighbors_level=None,
    n_jobs=8)

rz.predict_gene_expression()
[12/12/23 23:00:47] WARNING  Thor: Using all the genes. This may not be optimal and can be slow.
                    INFO     Thor: Using mode gene
                    INFO     Thor: Construct SNN with morphological features: ['mean_gray', 'std_gray', 'entropy_img', 'mean_r', 'mean_g', 'mean_b',
                             'std_r', 'std_g', 'std_b'].
[12/12/23 23:00:48] INFO     Thor: Finish constructing SNN
                    INFO     Thor: Add adata.obsp["snn_connectivities"]
                    INFO     Thor: Add adata.obsp["snn_knn_connectivities"]
                    INFO     Thor: Add adata.uns["snn"]
                    INFO     Thor: Weigh cells according to the spot heterogeneity.
                    INFO     Thor: Promote flow of information from more homogeneous cells to less.
                    INFO     Thor: Eliminate low quality edges (<0.1) between cells.
                    INFO     Thor: Compute transition matrix
                    INFO     Thor: self weight scale is set to: 0.200
                    INFO     Thor: Added transition matrix to adata.obsp["snn_transition_matrix"]
... storing 'spot_barcodes' as categorical
[12/12/23 23:00:49] INFO Thor: fineST estimation starts.
Creating piles: 100%|██████████| 8/8 [00:20<00:00,  2.60s/it]
MCMC Iteration: 100%|██████████| 20/20 [07:06<00:00, 21.31s/it]
MCMC Iteration: 100%|██████████| 20/20 [07:09<00:00, 21.46s/it]
MCMC Iteration: 100%|██████████| 20/20 [07:08<00:00, 21.43s/it]
MCMC Iteration: 100%|██████████| 20/20 [07:04<00:00, 21.22s/it]
MCMC Iteration: 100%|██████████| 20/20 [07:12<00:00, 21.63s/it]
MCMC Iteration: 100%|██████████| 20/20 [07:10<00:00, 21.50s/it]
MCMC Iteration: 100%|██████████| 20/20 [07:03<00:00, 21.20s/it]
MCMC Iteration: 100%|██████████| 20/20 [07:01<00:00, 21.08s/it]
[12/12/23 23:10:33] INFO Thor: fineST estimation finished.
[7]:
ad_thor = rz.load_result("fineST_20.npz")
sc.pp.normalize_total(ad_thor)
sc.pp.log1p(ad_thor)
ad_thor
[7]:
AnnData object with n_obs × n_vars = 32994 × 14467
    obs: 'n_counts', 'n_genes', 'percent.mt', 'Adipocyte', 'Cardiomyocyte', 'Endothelial', 'Fibroblast', 'Lymphoid', 'Mast', 'Myeloid', 'Neuronal', 'Pericyte', 'Cycling.cells', 'vSMCs', 'cell_type_original', 'assay_ontology_term_id', 'cell_type_ontology_term_id', 'development_stage_ontology_term_id', 'disease_ontology_term_id', 'ethnicity_ontology_term_id', 'is_primary_data', 'organism_ontology_term_id', 'sex_ontology_term_id', 'tissue_ontology_term_id', 'spot_barcodes', 'x', 'y', 'mean_gray', 'std_gray', 'entropy_img', 'mean_r', 'mean_g', 'mean_b', 'std_r', 'std_g', 'std_b', 'spot_heterogeneity', 'node_weights'
    var: 'features', 'used_for_prediction', 'used_for_reduced', 'used_for_vae'
    uns: 'X_approximate_distribution', 'X_normalization', 'default_embedding', 'schema_version', 'spatial', 'title', 'cell_image_props', 'snn', 'log1p'
    obsm: 'X_pca', 'X_spatial', 'X_umap', 'spatial'
    obsp: 'snn_connectivities', 'snn_knn_connectivities', 'snn_transition_matrix'
[8]:
palette = colors.continuous_palettes['blueYellow']
cmap = LinearSegmentedColormap.from_list('my_cmap', palette, N=256)
[9]:
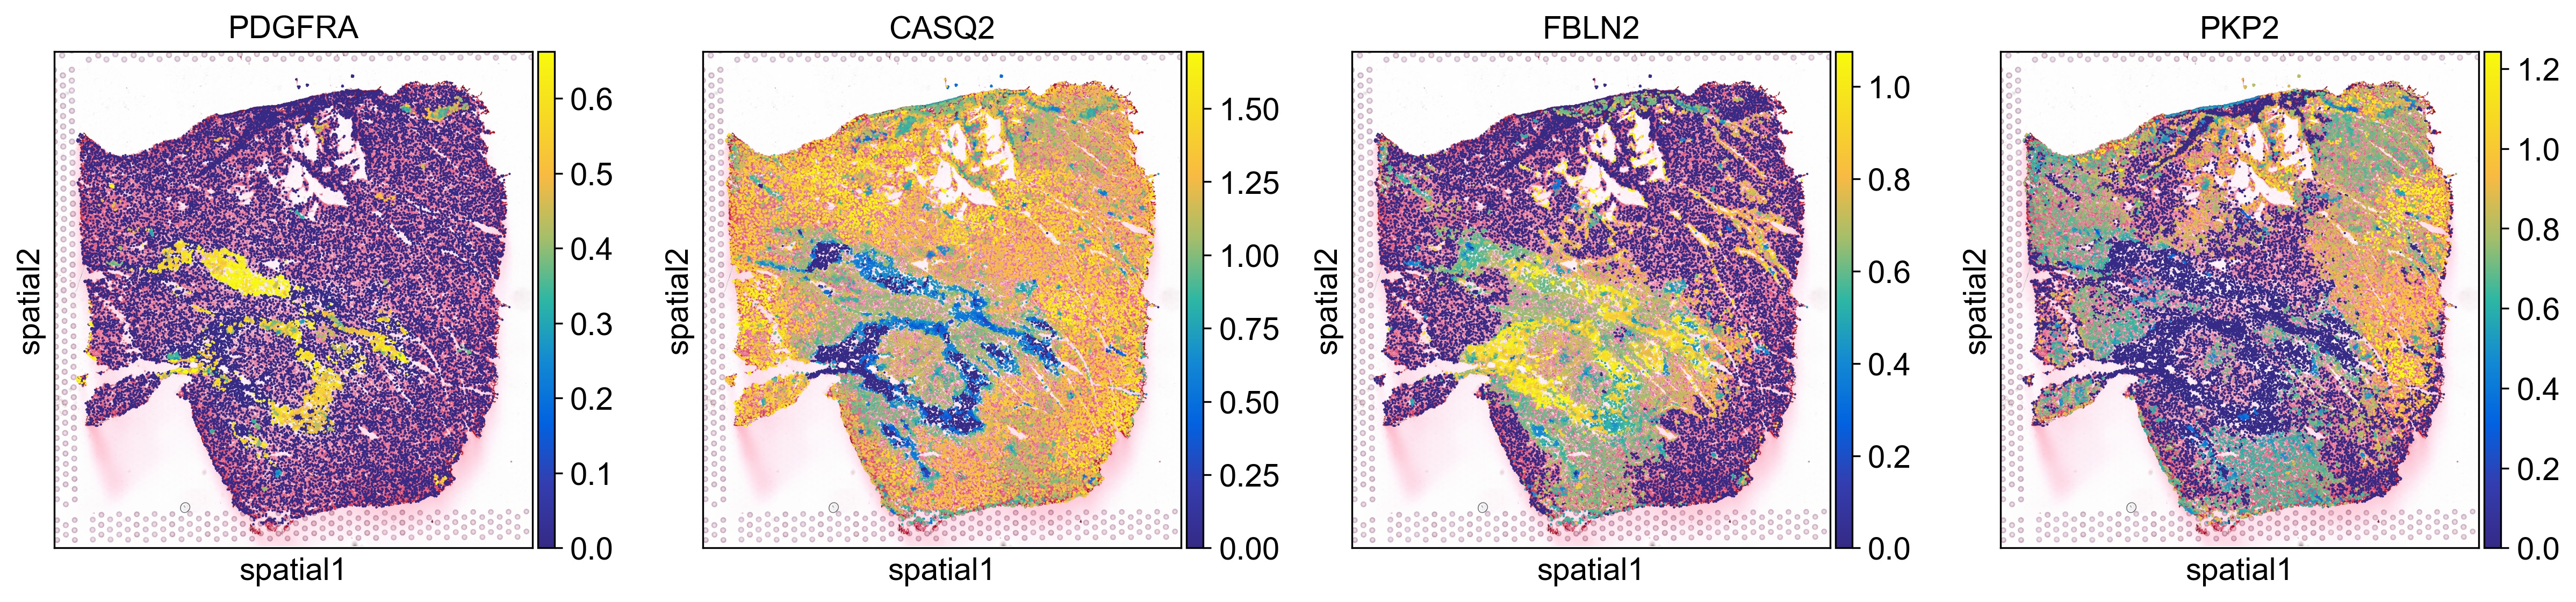
sc.pl.spatial(ad_thor, color=['PDGFRA', 'CASQ2', 'FBLN2', 'PKP2'], spot_size=40, use_raw=False, ncols=4, cmap=cmap, vmin='p1', vmax='p99')
Pathway enrichment analyses
Get the gene sets for the GO_BP pathways
[10]:
import decoupler as dc

msigdb = dc.get_resource('MSigDB')
msigdb = msigdb[msigdb['collection'] == 'go_biological_process']
msigdb = msigdb[~msigdb.duplicated(['geneset', 'genesymbol'])]
msigdb['geneset'] = [name.split('GOBP_')[1] for name in msigdb['geneset']]
msigdb
root - INFO - Downloading data from `https://omnipathdb.org/queries/enzsub?format=json`
root - INFO - Downloading data from `https://omnipathdb.org/queries/interactions?format=json`
root - INFO - Downloading data from `https://omnipathdb.org/queries/complexes?format=json`
root - INFO - Downloading data from `https://omnipathdb.org/queries/annotations?format=json`
root - INFO - Downloading data from `https://omnipathdb.org/queries/intercell?format=json`
root - INFO - Downloading data from `https://omnipathdb.org/about?format=text`
root - INFO - Downloading annotations for all proteins from the following resources: `['MSigDB']`
[10]:
| genesymbol | collection | geneset | |
|---|---|---|---|
| 33 | MAFF | go_biological_process | EMBRYO_DEVELOPMENT |
| 44 | MAFF | go_biological_process | POSITIVE_REGULATION_OF_RNA_METABOLIC_PROCESS |
| 82 | MAFF | go_biological_process | REGULATION_OF_EPITHELIAL_CELL_DIFFERENTIATION |
| 94 | MAFF | go_biological_process | EMBRYO_DEVELOPMENT_ENDING_IN_BIRTH_OR_EGG_HATC... |
| 108 | MAFF | go_biological_process | IN_UTERO_EMBRYONIC_DEVELOPMENT |
| ... | ... | ... | ... |
| 3838543 | PRAMEF22 | go_biological_process | POSITIVE_REGULATION_OF_CELL_POPULATION_PROLIFE... |
| 3838544 | PRAMEF22 | go_biological_process | APOPTOTIC_PROCESS |
| 3838545 | PRAMEF22 | go_biological_process | REGULATION_OF_CELL_DEATH |
| 3838546 | PRAMEF22 | go_biological_process | NEGATIVE_REGULATION_OF_DEVELOPMENTAL_PROCESS |
| 3838547 | PRAMEF22 | go_biological_process | NEGATIVE_REGULATION_OF_CELL_DEATH |
620627 rows × 3 columns
[11]:
ptw_list = [
    'POSITIVE_REGULATION_OF_T_CELL_PROLIFERATION',
    'POSITIVE_REGULATION_OF_INFLAMMATORY_RESPONSE',
    'POSITIVE_REGULATION_OF_IMMUNE_EFFECTOR_PROCESS',
    'POSITIVE_REGULATION_OF_B_CELL_ACTIVATION',
    'POSITIVE_REGULATION_OF_FIBROBLAST_PROLIFERATION',
    'COLLAGEN_FIBRIL_ORGANIZATION',
    'CARDIAC_MUSCLE_CONTRACTION'
    ]
msigdb = msigdb[msigdb.geneset.isin(ptw_list)]
msigdb
[11]:
| genesymbol | collection | geneset | |
|---|---|---|---|
| 3181 | GPR183 | go_biological_process | POSITIVE_REGULATION_OF_B_CELL_ACTIVATION |
| 5388 | RIPK2 | go_biological_process | POSITIVE_REGULATION_OF_IMMUNE_EFFECTOR_PROCESS |
| 5673 | RIPK2 | go_biological_process | POSITIVE_REGULATION_OF_T_CELL_PROLIFERATION |
| 12886 | CEBPB | go_biological_process | POSITIVE_REGULATION_OF_INFLAMMATORY_RESPONSE |
| 14576 | SPHK1 | go_biological_process | POSITIVE_REGULATION_OF_FIBROBLAST_PROLIFERATION |
| ... | ... | ... | ... |
| 3815299 | SASH3 | go_biological_process | POSITIVE_REGULATION_OF_IMMUNE_EFFECTOR_PROCESS |
| 3815331 | SASH3 | go_biological_process | POSITIVE_REGULATION_OF_T_CELL_PROLIFERATION |
| 3815499 | SASH3 | go_biological_process | POSITIVE_REGULATION_OF_B_CELL_ACTIVATION |
| 3826247 | TAFAZZIN | go_biological_process | CARDIAC_MUSCLE_CONTRACTION |
| 3838037 | HLA-DRB3 | go_biological_process | POSITIVE_REGULATION_OF_IMMUNE_EFFECTOR_PROCESS |
843 rows × 3 columns
Calculate the enrichment score using decoupler
[12]:
acts = get_pathway_score(ad_thor, layer=None, net_df=msigdb)
acts
Running ora on mat with 32994 samples and 14467 targets for 7 sources.
100%|██████████| 32994/32994 [00:28<00:00, 1175.86it/s]
[12]:
AnnData object with n_obs × n_vars = 32994 × 7
    obs: 'n_counts', 'n_genes', 'percent.mt', 'Adipocyte', 'Cardiomyocyte', 'Endothelial', 'Fibroblast', 'Lymphoid', 'Mast', 'Myeloid', 'Neuronal', 'Pericyte', 'Cycling.cells', 'vSMCs', 'cell_type_original', 'assay_ontology_term_id', 'cell_type_ontology_term_id', 'development_stage_ontology_term_id', 'disease_ontology_term_id', 'ethnicity_ontology_term_id', 'is_primary_data', 'organism_ontology_term_id', 'sex_ontology_term_id', 'tissue_ontology_term_id', 'spot_barcodes', 'x', 'y', 'mean_gray', 'std_gray', 'entropy_img', 'mean_r', 'mean_g', 'mean_b', 'std_r', 'std_g', 'std_b', 'spot_heterogeneity', 'node_weights'
    uns: 'X_approximate_distribution', 'X_normalization', 'cell_image_props', 'default_embedding', 'log1p', 'schema_version', 'snn', 'spatial', 'title'
    obsm: 'X_pca', 'X_spatial', 'X_umap', 'ora_estimate', 'ora_pvals', 'spatial', 'msigdb_ora_estimate', 'msigdb_ora_pvals'
    layers: 'smoothed'
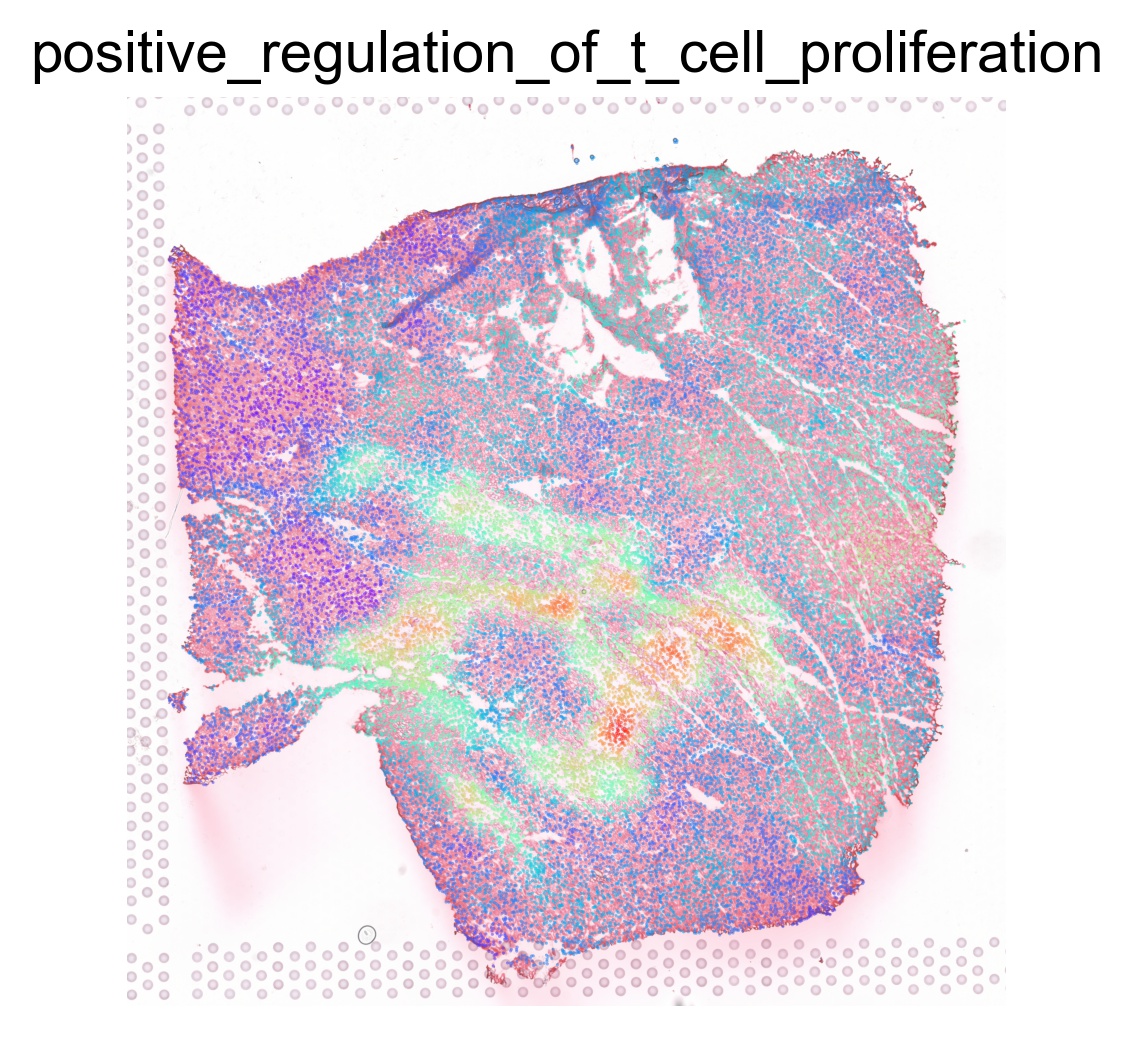
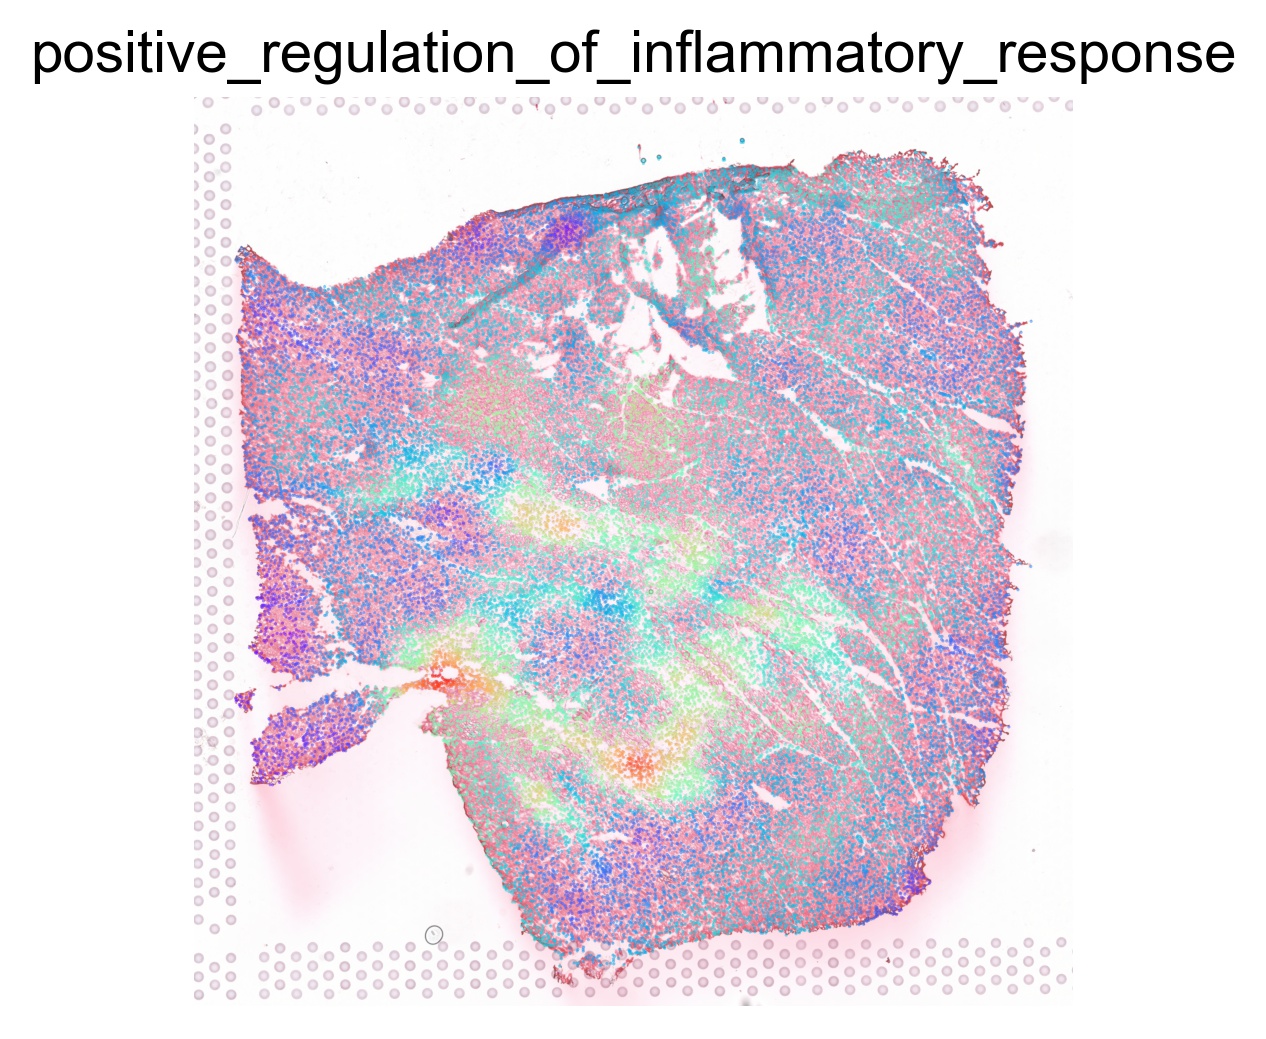
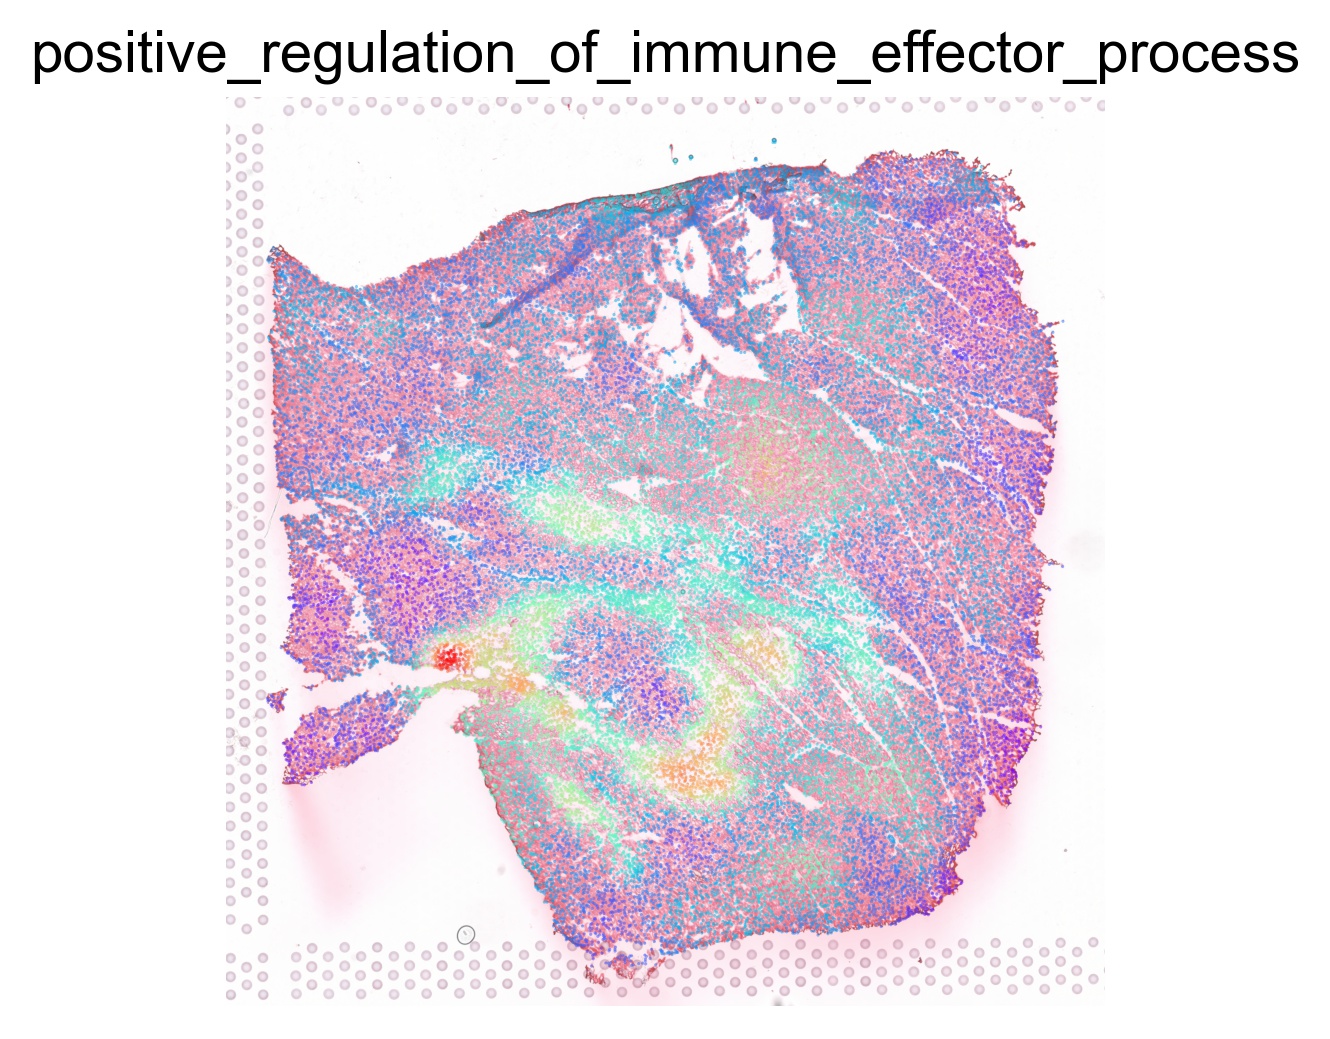
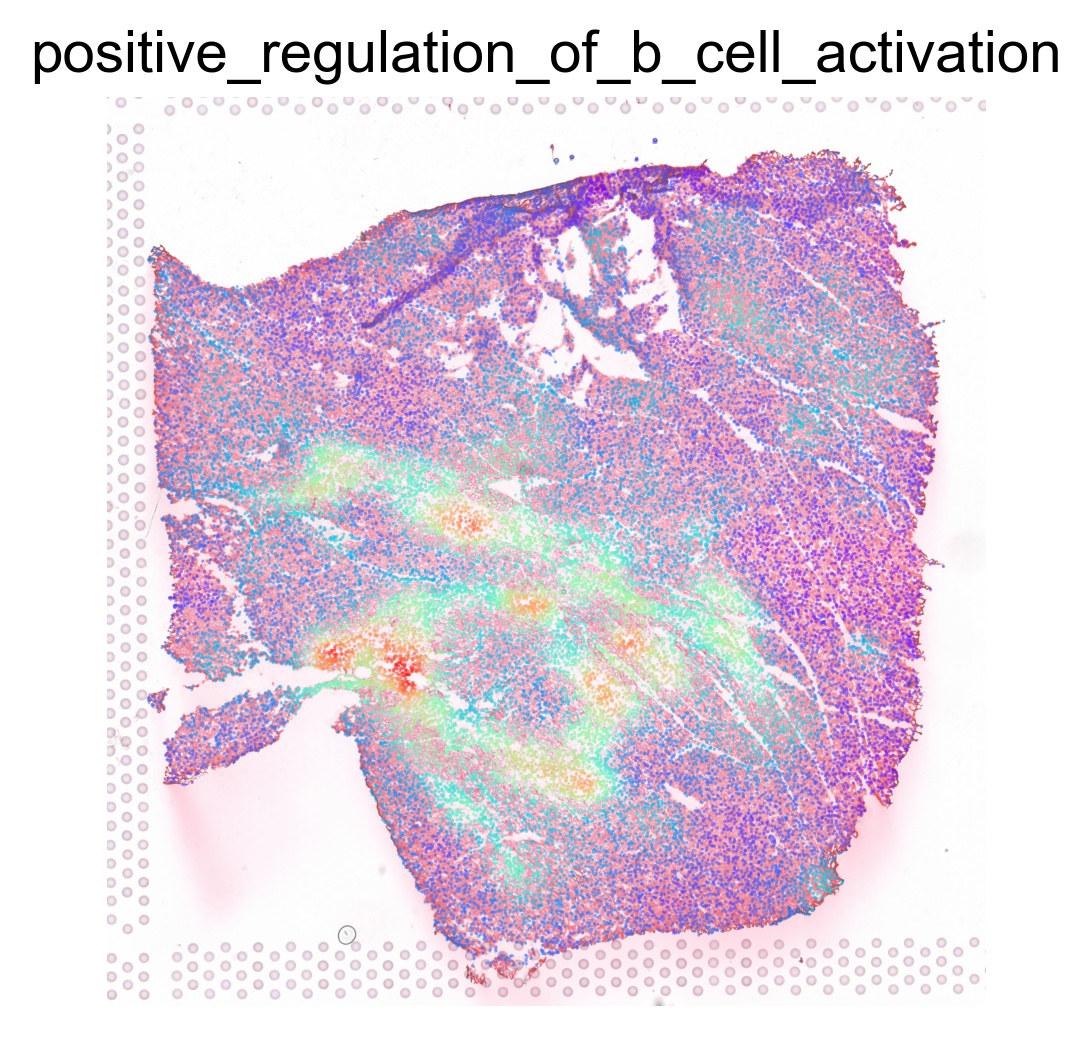
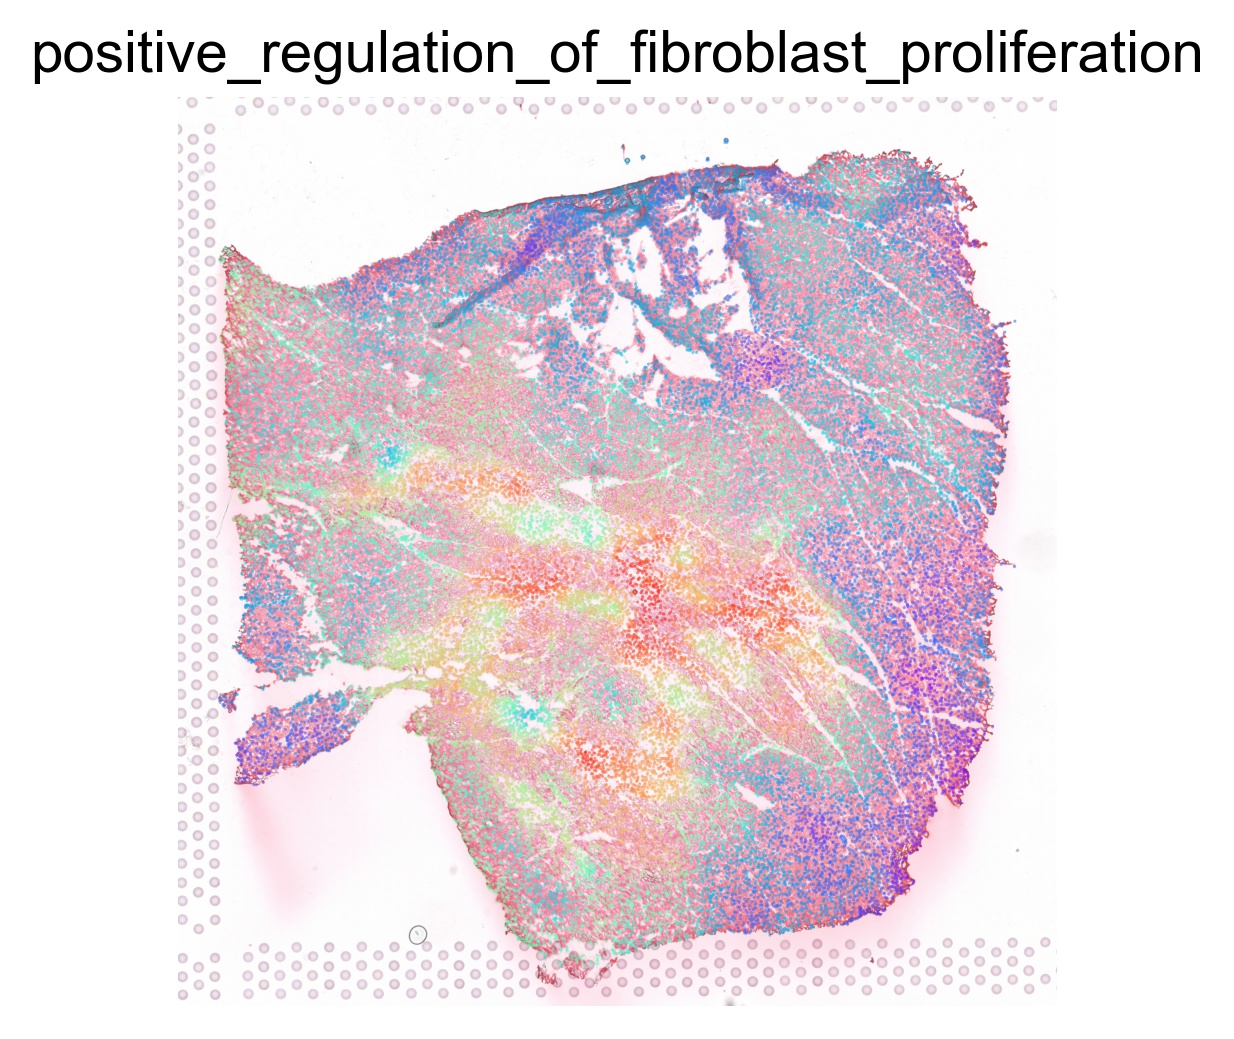
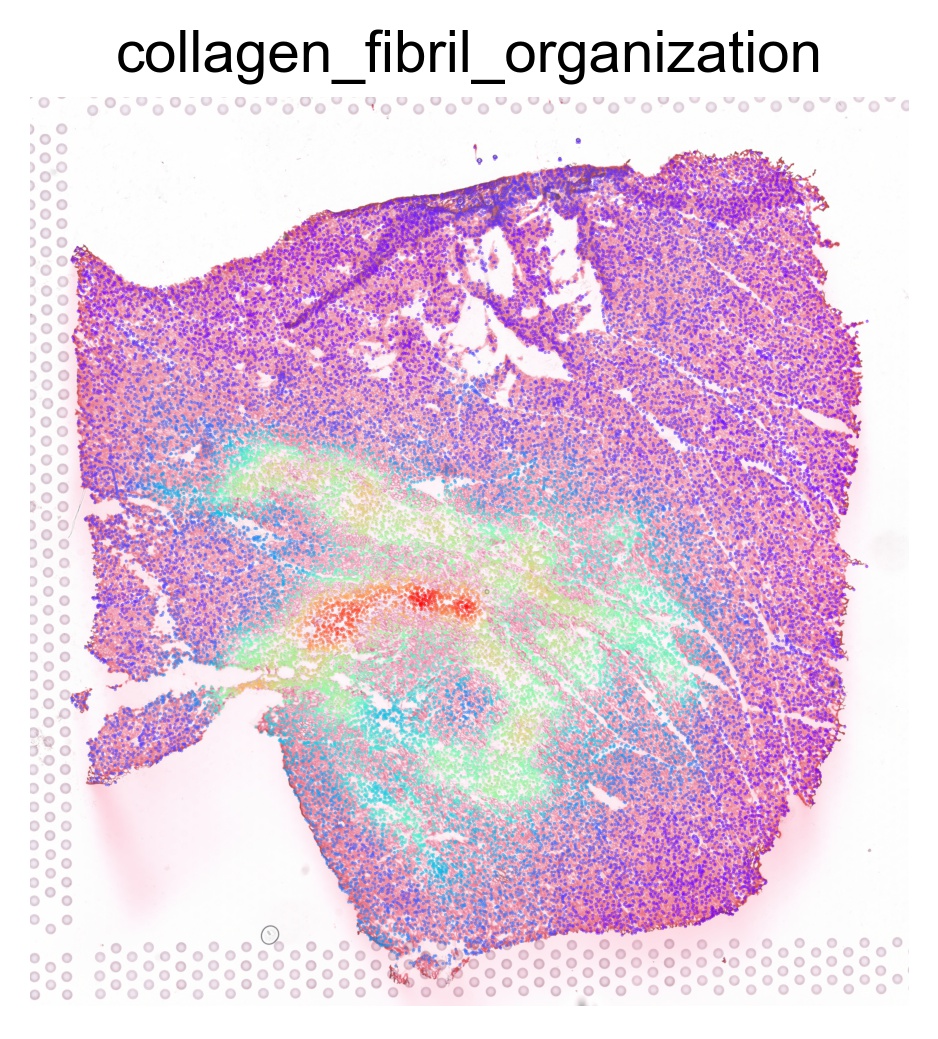
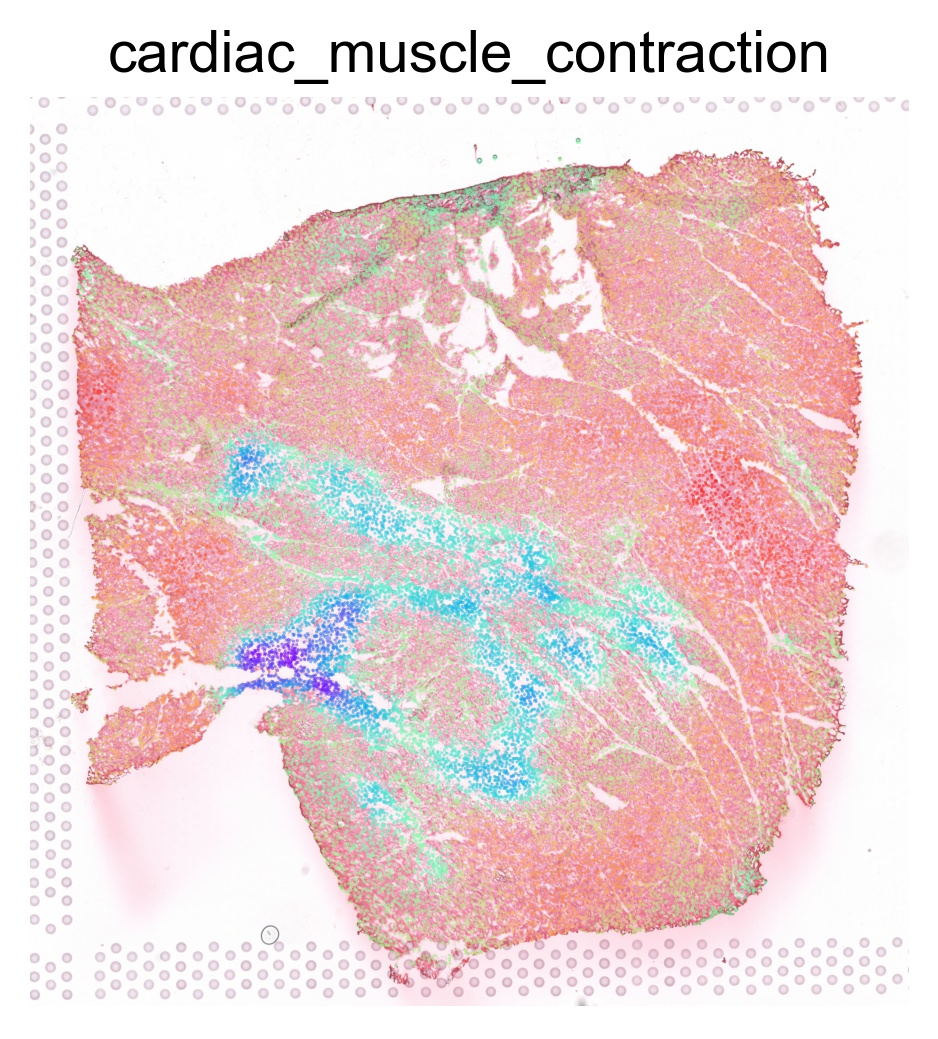
The pathway enrichment scores can be visualized on our interactive browser Mjolnir or using SCANPY as follows
[13]:
for pathway in ptw_list:
    sc.pl.spatial(acts, color=pathway, layer='smoothed', spot_size=30, use_raw=False, ncols=3, cmap='rainbow', frameon=False, title=pathway.lower(), colorbar_loc=None, alpha=0.5, alpha_img=0.7)
Transcription factor activity inference
Download the CollecTRI database.
[14]:
net = dc.get_collectri(organism='human', split_complexes=False)
net
root - INFO - Downloading data from `https://omnipathdb.org/queries/enzsub?format=json`
root - INFO - Downloading data from `https://omnipathdb.org/queries/interactions?format=json`
root - INFO - Downloading data from `https://omnipathdb.org/queries/complexes?format=json`
root - INFO - Downloading data from `https://omnipathdb.org/queries/annotations?format=json`
root - INFO - Downloading data from `https://omnipathdb.org/queries/intercell?format=json`
root - INFO - Downloading data from `https://omnipathdb.org/about?format=text`
[14]:
| source | target | weight | PMID | |
|---|---|---|---|---|
| 0 | MYC | TERT | 1 | 10022128;10491298;10606235;10637317;10723141;1... |
| 1 | SPI1 | BGLAP | 1 | 10022617 |
| 2 | SMAD3 | JUN | 1 | 10022869;12374795 |
| 3 | SMAD4 | JUN | 1 | 10022869;12374795 |
| 4 | STAT5A | IL2 | 1 | 10022878;11435608;17182565;17911616;22854263;2... |
| ... | ... | ... | ... | ... |
| 43173 | NFKB | hsa-miR-143-3p | 1 | 19472311 |
| 43174 | AP1 | hsa-miR-206 | 1 | 19721712 |
| 43175 | NFKB | hsa-miR-21-5p | 1 | 20813833;22387281 |
| 43176 | NFKB | hsa-miR-224-5p | 1 | 23474441;23988648 |
| 43177 | AP1 | hsa-miR-144 | 1 | 23546882 |
43178 rows × 4 columns
Calculate the TF activity based on regulated gene expression using decoupler
[15]:
acts = get_tf_activity(ad_thor, layer=None, net_df=net)
acts
Running ulm on mat with 32994 samples and 14467 targets for 659 sources.
100%|██████████| 4/4 [00:03<00:00, 1.20it/s]
[15]:
AnnData object with n_obs × n_vars = 32994 × 659
    obs: 'n_counts', 'n_genes', 'percent.mt', 'Adipocyte', 'Cardiomyocyte', 'Endothelial', 'Fibroblast', 'Lymphoid', 'Mast', 'Myeloid', 'Neuronal', 'Pericyte', 'Cycling.cells', 'vSMCs', 'cell_type_original', 'assay_ontology_term_id', 'cell_type_ontology_term_id', 'development_stage_ontology_term_id', 'disease_ontology_term_id', 'ethnicity_ontology_term_id', 'is_primary_data', 'organism_ontology_term_id', 'sex_ontology_term_id', 'tissue_ontology_term_id', 'spot_barcodes', 'x', 'y', 'mean_gray', 'std_gray', 'entropy_img', 'mean_r', 'mean_g', 'mean_b', 'std_r', 'std_g', 'std_b', 'spot_heterogeneity', 'node_weights'
    uns: 'X_approximate_distribution', 'X_normalization', 'cell_image_props', 'default_embedding', 'log1p', 'schema_version', 'snn', 'spatial', 'title'
    obsm: 'X_pca', 'X_spatial', 'X_umap', 'ora_estimate', 'ora_pvals', 'spatial', 'ulm_estimate', 'ulm_pvals', 'msigdb_ulm_estimate', 'msigdb_ulm_pvals'
    layers: 'smoothed'
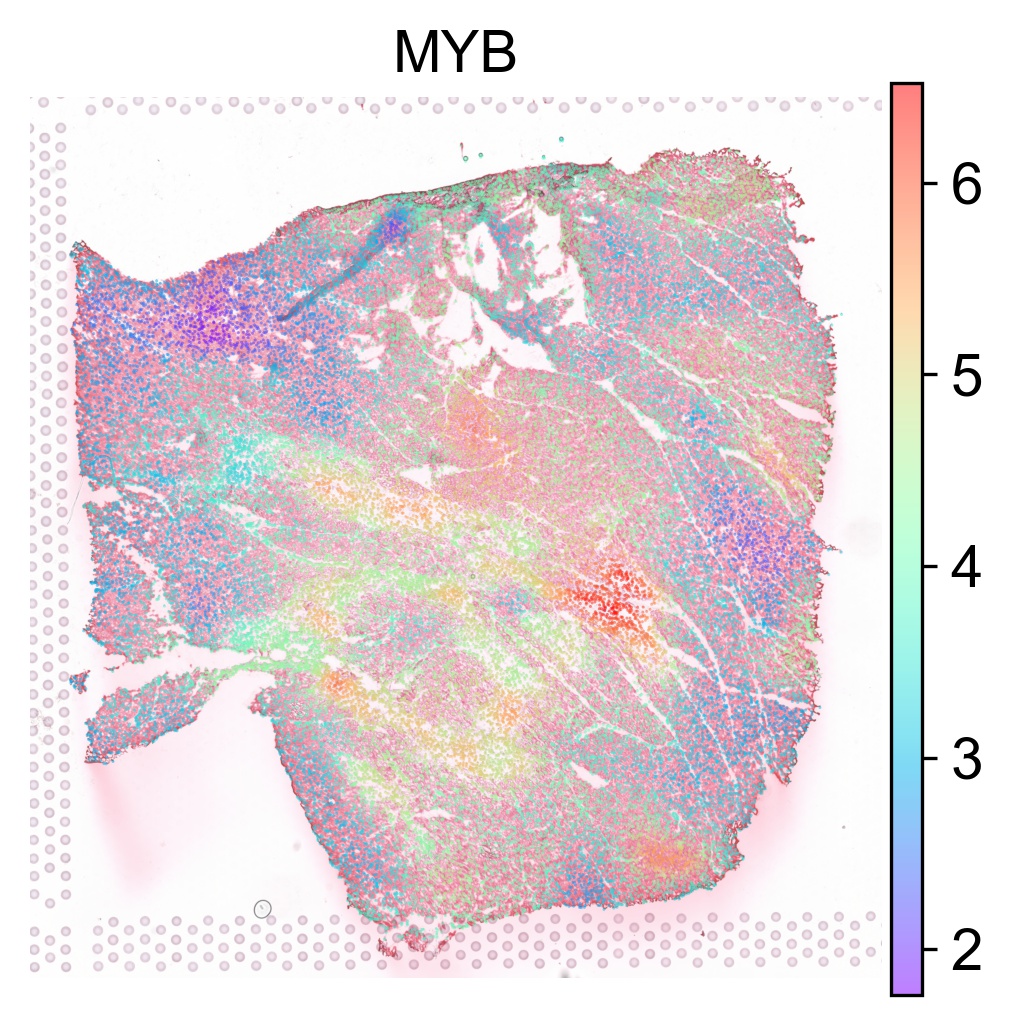
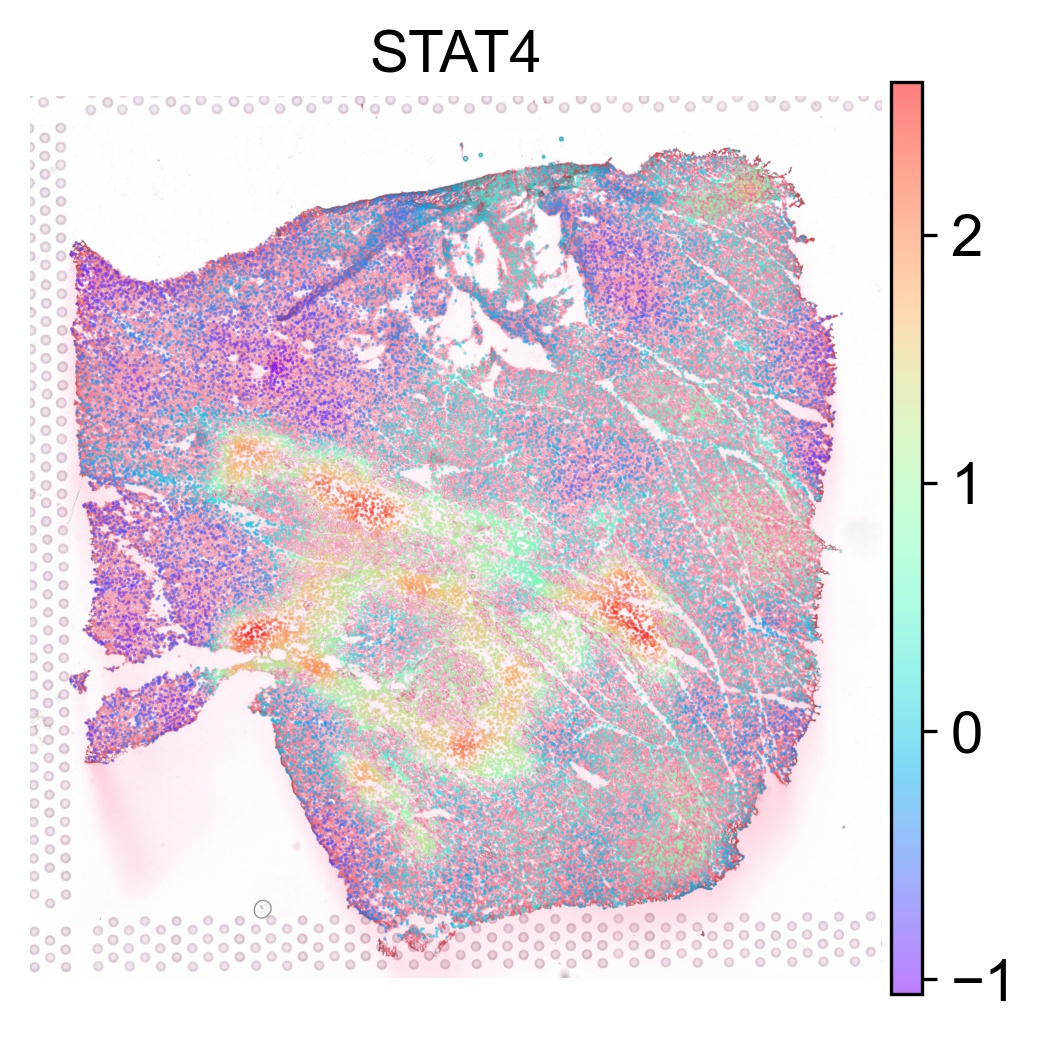
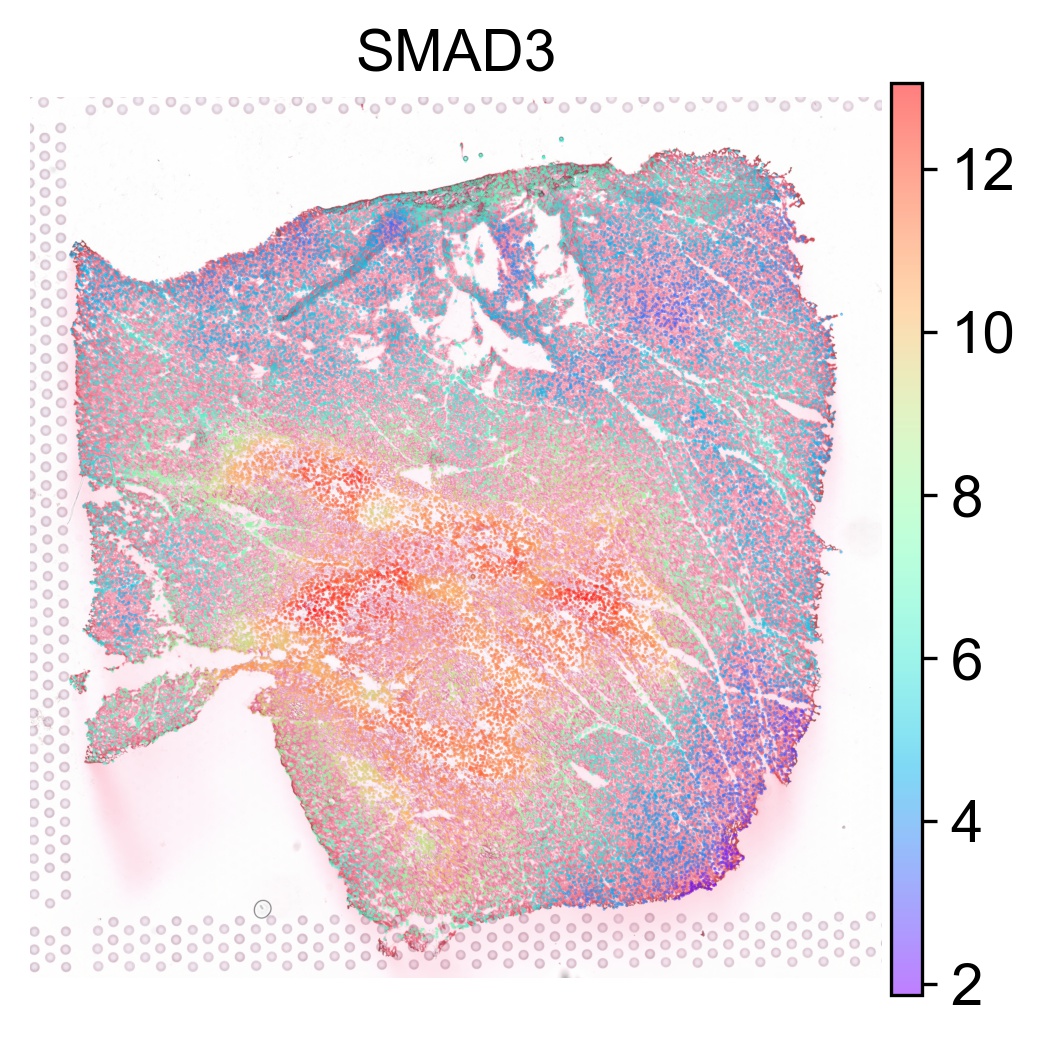
The TF activity score can be visualized on our interactive browser Mjolnir or using SCANPY as follows
[16]:
tf_list = ['MYB', 'STAT4', 'SMAD3']
for tf in tf_list:
    sc.pl.spatial(acts, color=tf, layer='smoothed', spot_size=30, use_raw=False, ncols=3, cmap='rainbow', frameon=False, title=tf, alpha=0.5, alpha_img=0.7)
Semi-supervised annotation
The semi-supervised annotation of similar cells can be performed on our web-based platform Mjolnir. Below are three video tips for how to use mjolnir.